Rise & Fall of the Dollar (Mostly Fall) 1800-Present
Click to See Larger Image:
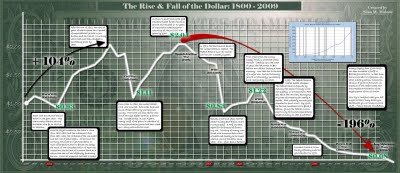
The above chart shows the rise and fall of the U.S. Dollar from 1800-Present. I will put in a little disclaimer here: I am not 100% sure of its accuracy, though it does present a very interesting case. Click on the picture to see a larger view of the chart. I will list the bubble talking points below as they can be somewhat difficult to read. Please feel free to post your thoughts on this chart, just click on “Leave a Comment” below the title of this post.
Disclaimer: The views expressed in this post are not necessarily those of Washington County Republican Women. This blog is for discussion purposes only.
__________________________________________________________________________
1. Start with the value of the US Dollar in the year 1800. This chart tracks relative value of the dollar with $1 in 1800 as its baseline.
2. Note the slight increase in the dollars value from 1800-1805 and the subsequent drop from 1811 when the 1st Bank of the US ended and the War of 1812 began. At the time, the currency was fixed to the gold standard, so most of the decline down to $ 0.93 was likely the result war-time destruction of resources. Historians cite the lack of a central bank as a reason that the US had difficulty financing the war. Wars are expensive and best to avoid.
3. After the war of 1812, the next 35 years of relative peace saw a period of unprecedented growth in production and as a result, a currency which had more than doubled in purchasing power by 1850.
4. From 1861-1865, the United States Civil War occured. Both sides financed much of their efforts by printing new money. The North was also able to raise funds through higher taxation and borrowing. Consequently, in just 4 years, nearly 100% of the gains in standard of living and purchasing power had been wiped out.
5. A return to lower taxes and the gold standard fueled further economic growth and resulted in 40 years of improved purchasing power – returning all the pre-Civil War gains by 1900.
6. In 1913, the 3rd central bank of the United States was created. The Federal Reserve now has control of the US’ monetary system.
7. Between 1917 and 1920, the Fed added roughly 15 billion to the money supply – a 75% increase, again for the purpose of financing war. Printing of money combined with immense destruction of wealth lead directly to the lowest relative value of the dollar since 1800.
8. From 1920-1928, the money supply remains somewhat static. However – leading up to the crash of 1929, the Fed pumps in $10 billion new dollars fueling a boom economy. Note that due to a lack of a major war, and revolutionary growth in technology, purchasing power marginally increases.
9. 1929: The Federal Reserve created bubble collapse. The Federal Reserve responds by reducing the stock of money in the US slightly, in the meantime, FDR sets about the New Deal, destroying any hope of prosperity for nearly a decade. FDR critically wounds gold standard to fund WWII. By 1946, the Fed has increased M2 to $138.7 billion, giving the federal government a way to fund all expenditures based primarily on debt and inflation.
10. President Richard Nixon finally officially ends the gold standard in 1971.
11. Money supply from 1946-2009 has been increased by 5.938% to $8,235,900,000,000. In that time, the US has seen 10 recessions, constant military action, massive expansion of government power, an explosion of the welfare state and the complete annihilation of the buying power of the US Dollar.
Now try to imagine what your life might be like if every dollar you had bought you 20 times as much stuff… This is the cost of inflation.
___________________________________________________________________________


Comments are closed.